Free Forex Trading Signals For 10 . 01 . 2024

Free Forex Trading Signals For 10.01.2024

Free Forex Signals

In the dynamic world of foreign exchange trading, staying ahead of the curve is crucial for making informed decisions . Today , we will analyze the current trends in major currency pairs and Gold as well as Bitcoin , providing potential buy or sell points based on recent market movements .

EUR / USD Current Price : 1 . 1063

The Euro to US Dollar pair has been showing signs of consolidation near its current level . If the price breaks above the resistance at 1 . 1080 , it could signal a bullish trend continuation towards the next resistance at 1 . 1100 . Conversely , if the support at 1 . 1040 is broken , this might indicate a bearish move setting up a sell opportunity .

GBP / USD Current Price : 1 . 3271

Sterling has maintained strength against the Dollar , trading around 1 . 3271 . A break above 1 . 3300 could be seen as a bullish signal , opening the door for further gains . However , if the price retreats below the key support level at 1 . 3250 , traders may consider entering short positions expecting a downward move .

USD / JPY Current Price : 143 . 75

The Dollar to Yen exchange rate has been relatively stable . A clear breakout above 144 . 00 would confirm a bullish scenario targeting higher levels . On the flip side , failure to hold above 143 . 50 might suggest weakening Dollar strength and could be a cue for selling .

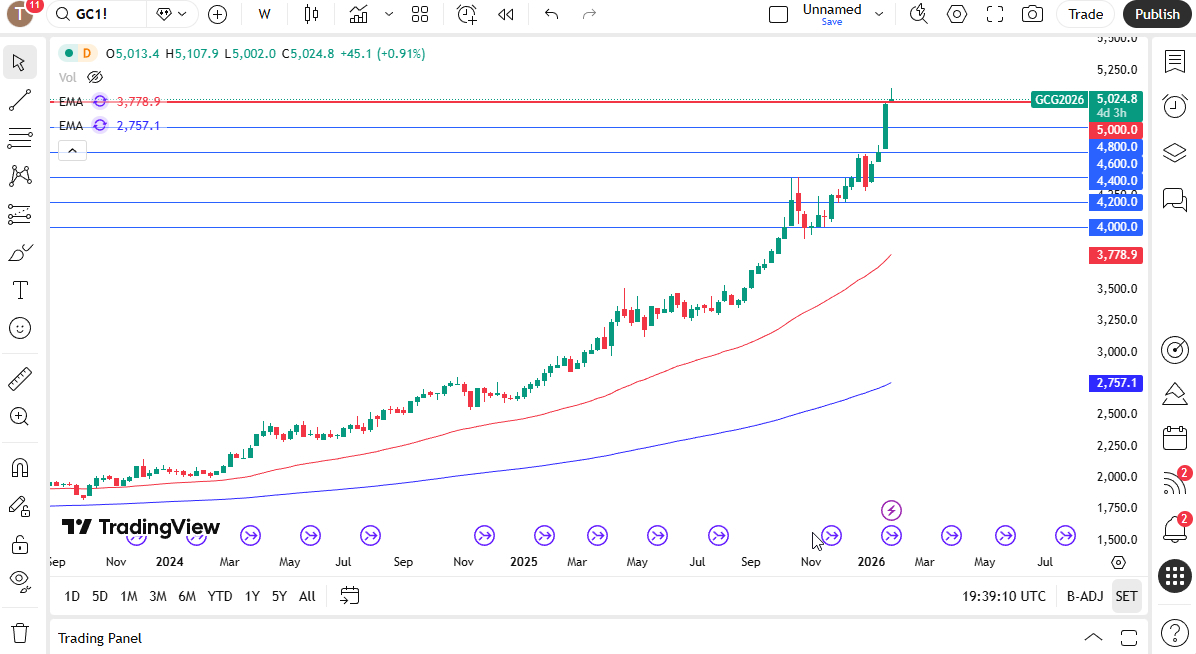
Gold Current Price : 2663 . 53

Precious metals like Gold continue to attract investors seeking safe havens . With Gold trading at 2663 . 53 , watching for a break above recent highs of 2670 could provide a buying opportunity . Alternatively , should prices dip below the psychological support at 2650 , it might trigger sell signals .

BTCUSD Current Price : 62392 . 46

Bitcoin remains volatile but has shown resilience staying above significant support levels . Should Bitcoin surge past the key resistance at 63000 , buyers could take control pushing prices higher . In contrast , a drop below 61000 might lead to increased selling pressure .

If you wish to get the latest forex brokers, you can visit our Top Forex Brokers official website:

https://www.topforexbrokerscomparison.com

Remember , these signals are based on current market conditions and general technical analysis principles . Always incorporate risk management strategies such as stop-loss orders when trading . Additionally , consider economic news releases that can impact currency pairs unexpectedly .

Happy trading and stay vigilant !

Free Forex Trading Signals For 09.30.2024

Free Forex Trading Signals For 09.30.2024

Free Forex Signals

Navigating the forex markets successfully often hinges on being able to interpret current trends accurately and positioning oneself accordingly. Here is a detailed analysis of key currency pairs and commodities as of September 30, 2024, followed by suggested buy or sell points based on prevailing market conditions.

EUR/USD

Current Price: 1.1139

The EUR/USD exchange rate is currently trading at 1.1139. Over the past few days, the pair has shown some volatility but remains within a defined range. Support is found at 1.1100, while resistance lies at 1.1180. A breakout below the support level could signal a continuation of the downward trend, suggesting a sell signal. Alternatively, a clear break above the resistance level would imply a potential shift upwards, indicating a buy signal.

GBP/USD

Current Price: 1.3392

The GBP/USD pair is trading at 1.3392. The pair appears to be consolidating after a period of fluctuation, with key support at 1.3350 and resistance at 1.3450. Traders should look for a decisive move outside this range for confirmation of direction. A break below 1.3350 could lead to a bearish trend, while a push above 1.3450 would confirm a bullish trend, prompting a buy signal.

USD/JPY

Current Price: 143.18

The USD/JPY pair is currently valued at 143.18. It has been relatively stable recently, with support at 142.50 and resistance at 144.00. A close below the support level would indicate weakening demand for the dollar against the yen, suggesting a sell signal. On the other hand, a close above the resistance level would indicate strengthening demand, providing a buy signal.

Gold

Current Price: 2637.24

Gold is trading at 2637.24perounce.Thepreciousmetalhasestablishedsupportaround2637.24perounce.Thepreciousmetalhasestablishedsupportaround2620.00 and resistance near 2650.00.Traderslookingforopportunitiesingoldshouldwatchforabreakoutfromthisrange.Amovebelow2650.00.Traderslookingforopportunitiesingoldshouldwatchforabreakoutfromthisrange.Amovebelow2620.00 could indicate a bearish sentiment, offering a sell opportunity, while a rise above $2650.00 might suggest a bullish move, presenting a buy opportunity.

BTC/USD

Current Price: 63545.96

Bitcoin is currently priced at 63545.96.Thecryptocurrencyhasestablishedasupportlevelaround63545.96.Thecryptocurrencyhasestablishedasupportlevelaround62000.00 and a resistance level near $65000.00. A significant move below the support level could signal a downturn, potentially leading to a sell signal. Conversely, a strong move above the resistance level could indicate increasing bullish momentum, suggesting a buy signal.


If you wish to get the latest forex brokers, you can visit our Top Forex Brokers official website:

https://www.topforexbrokerscomparison.com

It is important to remember that while these signals provide insights based on current market analysis, they should not replace thorough personal research or professional advice. Trading involves risks, including the potential loss of capital, and strategies should be implemented carefully with consideration of individual risk tolerance. Always use appropriate risk management tools, like stop-loss orders, to protect your investments.

Free Forex Trading Signals For 09.27.2024

Free Forex Trading Signals For 09.27.2024

Free Forex Signals

In the dynamic world of foreign exchange trading, staying ahead requires not only a keen eye for detail but also an understanding of broader market trends. We provides an analysis of key currency pairs and commodities as of September 27, 2024, along with suggested buy or sell points based on current market conditions.

EUR/USD

Current Price: 1.1183

The EUR/USD pair has been showing signs of consolidation after a recent downtrend. With support levels around 1.1150 and resistance at 1.1220, traders might consider a short position if the price breaks below the support level, indicating further bearish momentum. Conversely, a break above 1.1220 could signal a potential reversal and warrant a long position.

GBP/USD

Current Price: 1.3401

The British Pound against the US Dollar (GBP/USD) is trading in a range-bound market with support at 1.3350 and resistance at 1.3450. A breakout to either side could offer opportunities. A close below 1.3350 might suggest a downtrend continuation, while a move above 1.3450 could indicate a bullish trend, suggesting traders to go long.

USD/JPY

Current Price: 142.56

The USD/JPY pair remains volatile due to geopolitical factors and economic data releases. With immediate support at 142.00 and resistance at 143.00, traders should watch for a clear breakout. A sustained move above 143.00 could be a bullish sign, while a drop below 142.00 might indicate a bearish move.

Gold

Current Price: 2666.26

Gold prices continue to reflect global economic uncertainties. At its current level, gold finds support around 2650.00 and resistance near 2700.00. Traders may look for buying opportunities on dips towards 2650.00 or selling opportunities if gold breaks above 2700.00, signaling strength.

BTC/USD

Current Price: 65418.45

Bitcoin’s price action has been influenced by regulatory news and institutional adoption. With support at 64000.00 and resistance at 66000.00, Bitcoin traders should remain cautious. A break above 66000.00 could indicate growing bullish sentiment, whereas a fall below 64000.00 might suggest increased selling pressure.


If you wish to get the latest forex brokers news,you can visit our Top Forex Brokers official website:

https://www.topforexbrokerscomparison.com

Please note that while these signals provide guidance based on current technical analysis, they should not be taken as financial advice. Always conduct your own research and consider consulting with a financial advisor before making any trading decisions. Keep in mind that the forex market can be highly volatile, and positions should be managed with appropriate risk control measures such as stop-loss orders.

Free Forex Trading Signals For 09 . 26 . 2024

Free Forex Trading Signals For 09.26.2024

Free Forex Signals

Navigating the complex landscape of the foreign exchange (Forex) market requires a keen eye on current trends and a strategic approach to trading. As of September 26, 2024, let’s take a closer look at the latest prices for key currency pairs, gold, and Bitcoin, and explore potential buy or sell positions based on these trends.

EUR / USD

The EUR / USD pair is currently trading at 1 . 1185. To determine a potential trading position, traders need to consider recent economic data from both the Eurozone and the United States. If recent economic reports from Europe show signs of improvement over those from the U.S., it might suggest a buy signal for the EUR / USD pair, expecting the euro to gain strength. Conversely, if the U.S. economic indicators are more positive, a sell signal might be appropriate, anticipating a weakening of the euro against the dollar.

GBP / USD

At a price of 1 . 3427, the GBP / USD pair is influenced by a myriad of factors including geopolitical events and economic policies. Given the ongoing negotiations and political climate, traders should watch for any news that could affect the British pound. A bullish sentiment towards the pound could warrant a buy position, while a bearish outlook might prompt a sell decision.

USD / JPY

The USD / JPY pair stands at 144 . 64. Movements in this pair are typically driven by interest rate differentials and the overall risk appetite of investors. If the U.S. Federal Reserve indicates a more hawkish stance than the Bank of Japan, the dollar could strengthen against the yen, suggesting a potential buy opportunity. In contrast, if there is a shift towards safer assets, the yen might strengthen, signaling a sell position.

Gold

With gold priced at 2671 . 00, the precious metal continues to be viewed as a safe haven asset. Global economic uncertainties or rising inflation expectations could drive demand for gold, indicating a possible buy signal. However, during periods of economic stability and growth, selling gold might be considered as part of a balanced portfolio strategy.

BTC / USD

Bitcoin, trading at 65242 . 57, is subject to fluctuations due to regulatory developments, technological advancements, and investor sentiment. For traders looking to capitalize on short-term movements, technical analysis tools such as moving averages can offer insights into potential entry and exit points. Due to the high volatility associated with cryptocurrencies, cautious positioning is advised.

Understanding the nuances of the Forex market is critical for making informed trading decisions. By monitoring economic indicators, geopolitical events, and technical signals, traders can better anticipate market movements and adjust their strategies accordingly. Remember, while the above analysis provides guidance, it is always recommended to conduct thorough research and possibly seek advice from a financial advisor before making any trading decisions.

If you wish to get the latest forex brokers news,you can visit our Top Forex Brokers official website:

https://www.topforexbrokerscomparison.com

Disclaimer: The information provided here is intended for educational purposes only and should not be construed as financial advice. Always consider your personal circumstances and consult with a professional before making investment decisions.

Free Forex Trading Signals for August 9, 2024

Free Forex Signals

August 9, 2024 – Today’s market analysis and trading signals for major currency pairs, gold, and Bitcoin. Here’s a snapshot of the current market conditions as of today:

  • EUR/USD: Current price at 1.0914.
  • GBP/USD: Current price at 1.2739.
  • USD/JPY: Current price at 146.90.
  • Gold: Current price at $2,426.969 per ounce.
  • BTC/USD: Current price at $60,688.62.

EUR/USD Analysis

The EUR/USD pair has shown a slight upward movement, with the current price at 1.0914. The European Central Bank (ECB) recently announced no significant changes to its monetary policy, which has helped stabilize the euro. However, traders should keep an eye on the upcoming US Non-Farm Payrolls (NFP) report, which could affect the pair’s direction.

Trading Signal: Consider buying at 1.0900 with a stop loss at 1.0860 and a take profit target at 1.0960.

GBP/USD Analysis

The GBP/USD pair is currently trading at 1.2739. The pound has gained strength following better-than-expected GDP growth figures from the UK. However, Brexit negotiations and the possibility of new trade agreements continue to influence the currency’s value.

Trading Signal: Consider buying at 1.2700 with a stop loss at 1.2650 and a take profit target at 1.2800.

USD/JPY Analysis

The USD/JPY pair is trading at 146.90. With the US-China trade talks showing signs of progress, risk sentiment has improved, leading to a weaker yen. However, geopolitical tensions in the region could cause the yen to strengthen again.

Trading Signal: Consider selling at 147.20 with a stop loss at 147.70 and a take profit target at 146.50.

Gold Analysis

Gold, often seen as a safe haven asset, is currently trading at $2,426.969 per ounce. The precious metal has seen a slight increase in value, likely due to uncertainty in global markets. Investors are closely watching the Federal Reserve’s next move, which could influence gold’s direction.

Trading Signal: Consider buying at 2,420withastoplossat2,420withastoplossat2,400 and a take profit target at $2,450.

BTC/USD Analysis

Bitcoin is currently trading at $60,688.62. The cryptocurrency market has been relatively stable in recent weeks, with Bitcoin holding above key support levels. However, traders should be cautious of sudden volatility that can occur due to regulatory news or large institutional movements.

Trading Signal: Consider buying at 60,000withastoplossat60,000withastoplossat58,000 and a take profit target at $62,000.


Today’s market conditions indicate a mix of opportunities and risks across various assets. Traders should remain vigilant and adapt their strategies according to the latest economic indicators and geopolitical events. Remember to manage your risk effectively and consider setting up alerts for key levels and news releases.

For more detailed insights and personalized advice, consult with a financial advisor or use professional trading tools to stay ahead in the fast-paced world of forex and commodities trading.

If you wish to get the latest forex brokers news,you can visit our Top Forex Brokers official website:

https://www.topforexbrokerscomparison.com

Disclaimer: This article provides general information and should not be considered as financial advice. Always conduct your own research and consult with a professional before making investment decisions.

Free Forex Trading Signals For 08.07.2024

Free Forex Trading Signals For 08.07.2024

Free Forex Signals

In the fast-paced world of foreign exchange (forex) trading, staying ahead of market movements is key to making profitable trades. Today, we will provide you with free forex trading signals for three major currency pairs—EUR/USD, GBP/USD, and USD/JPY—and gold. These signals are based on current market conditions as of August 7, 2024, and aim to guide your trading strategy.

EUR/USD

Current Price: 1.0922

Analysis:

The EUR/USD pair has been showing signs of consolidation within a tight range over the past few days. The price currently stands at 1.0922, which is slightly above the support level of 1.0900. The Relative Strength Index (RSI) is hovering around 50, indicating neutral sentiment in the market.

Signal:

  • Buy: Consider entering a long position if the price breaks above the resistance level of 1.0950.
  • Stop Loss: Place a stop loss below 1.0900 to protect against potential reversals.
  • Take Profit: Set a take-profit target near 1.1000, where the next significant resistance lies.

GBP/USD

Current Price: 1.2722

Analysis:

The GBP/USD pair has been trending upwards, breaking through key resistance levels. The price is now at 1.2722, and there is strong momentum indicated by the Moving Average Convergence Divergence (MACD) line crossing above the signal line.

Signal:

  • Buy: Enter a long position as the trend suggests further upside potential.
  • Stop Loss: Set a stop loss just below the recent support level at 1.2650.
  • Take Profit: Target a take-profit level around 1.2850, where the next resistance zone is located.

USD/JPY

Current Price: 147.05

Analysis:

The USD/JPY pair has been relatively stable but with a slight bearish bias. The price is currently at 147.05, and the RSI is showing a value of 45, suggesting a neutral-to-slightly bearish sentiment.

Signal:

  • Sell: Consider opening a short position if the price breaks below the support level of 146.50.
  • Stop Loss: Place a stop loss above 147.50 to mitigate risk.
  • Take Profit: Aim for a take-profit target near 145.00, where the next support zone is expected.

Gold

Current Price: $2,396.96

Analysis:

Gold prices have been steadily increasing, driven by geopolitical uncertainties and inflationary pressures. The price of gold is currently at $2,396.96, and the Bollinger Bands indicate that the price is likely to continue its upward trend.

Signal:

  • Buy: Enter a long position given the overall bullish trend.
  • Stop Loss: Place a stop loss below $2,350 to limit losses.
  • Take Profit: Set a take-profit target near $2,450, where the next resistance level is anticipated.

These trading signals are provided for informational purposes only and should not be considered financial advice. Always conduct your own research and consider consulting with a professional advisor before making any trading decisions. Remember that forex trading involves significant risks, including the possibility of losing more than your initial investment.

If you wish to get the latest forex brokers news,you can visit our Top Forex Brokers official website:

https://www.topforexbrokerscomparison.com

Free Forex Trading Signals for 08.06.2024

Free Forex Trading Signals for 08.06.2024

Free Forex Signals
androidEURUSD
EURUSD faces a critical resistance zone at 1.0940, which aligns with the golden Fibonacci ratio and a key trendline.
The Momentum oscillator crossing above the 100 line indicates strong bullish sentiment. 
•If the price rebounds from the 1.0940 resistance, it could fall to 1.0790;
•A break above the trendline might lead to a further rise towards 1.1100.
androidUS500
US500 faces crucial support at 5200, aligned with the golden Fibonacci ratio.
The MFI and RSI oscillators show oversold conditions, potentially giving two scenarios. 
•If the price rebounds off 5200, it may propel to 5325;
•If the price breaches below the golden Fibonacci, it may fall to 5010.
androidUSDCAD
USDCAD is nearing a critical resistance level, aligned with the 138.2 Fibonacci ratio.
The DeMarker oscillator shows a bearish divergence with the asset. 
•If the price breaks the 1.3880 resistance, it will start rising to 1.3930;
•A rebound from the 138.2 Fibonacci will bring it down to 1.3800 support.

These trading signals are intended to provide insights into potential trading opportunities. It is important to remember that the Forex market is highly dynamic, and market conditions can change rapidly. Always use appropriate risk management techniques and stay updated with the latest economic news that may impact the markets.

If you wish to get the latest forex brokers news,you can visit our Top Forex Brokers official website:

https://www.topforexbrokerscomparison.com

Free Forex Trading Signals for 08.02.2024

Free Forex Trading Signals for 08.02.2024

Free Forex Signals

In the dynamic world of foreign exchange (Forex), staying ahead of market movements is crucial for traders seeking to capitalize on opportunities. Today, we will provide you with free Forex trading signals for August 2, 2024, based on technical analysis and current market conditions. These signals are designed to help you make informed decisions in your trading activities. Remember that while these signals can be useful, they should be used in conjunction with your own analysis and risk management strategies.

Disclaimer

The information provided here is for educational purposes only and should not be considered financial advice. Trading involves significant risks, including the potential loss of capital. Always conduct your own research and consider consulting with a financial advisor before making any trading decisions.


Market Overview

As of August 2, 2024, the global economy continues to show signs of stability. Central banks around the world have been cautious in their monetary policy adjustments, which has led to a relatively stable environment for currency traders. However, geopolitical tensions remain a key factor affecting market sentiment.

Technical Analysis Indicators

  • Moving Averages: The 50-day and 200-day moving averages are being closely watched as key support and resistance levels.
  • Relative Strength Index (RSI): Most major currency pairs are trading within normal ranges, but some show signs of overbought or oversold conditions.
  • Bollinger Bands: These bands indicate volatility levels, with wider bands suggesting increased movement potential.

Trading Signals

Here are our top trading signals for today:

EUR/USD

  • Current Price: 1.0891
  • Support Levels: 1.0850, 1.0800
  • Resistance Levels: 1.0950, 1.1000
  • Signal: Buy on a break above 1.0950 with a stop loss at 1.0850 and a take profit at 1.1020. This signal is based on the pair’s recent bullish trend and the possibility of further upside momentum. The RSI is currently neutral, indicating room for upward movement without overbought conditions.

GBP/USD

  • Current Price: 1.2798
  • Support Levels: 1.2750, 1.2700
  • Resistance Levels: 1.2850, 1.2900
  • Signal: Sell if the price breaks below 1.2750 with a stop loss at 1.2850 and a take profit at 1.2680. This signal is based on the bearish divergence seen in the RSI and the potential for a continuation of the downtrend. The pair has been consolidating near the support level, and a break below could indicate a continuation of the bearish trend.

USD/JPY

  • Current Price: 147.36
  • Support Levels: 147.00, 146.50
  • Resistance Levels: 148.00, 148.50
  • Signal: Buy on a strong break above 148.00 with a stop loss at 147.00 and a take profit at 149.00. This signal takes into account the recent bullish momentum and the possibility of further appreciation against the Japanese yen. The pair is currently trading near the upper Bollinger Band, suggesting that the trend could continue with further upward movement.

These trading signals are intended to provide insights into potential trading opportunities. It is important to remember that the Forex market is highly dynamic, and market conditions can change rapidly. Always use appropriate risk management techniques and stay updated with the latest economic news that may impact the markets.

If you wish to get the latest forex brokers news,you can visit our Top Forex Brokers official website:

https://www.topforexbrokerscomparison.com

Predicting : When the United States Will Cut Interest Rates

interest rates

Predicting when the Federal Reserve (Fed) will cut interest rates is a complex task that involves analyzing a wide range of economic indicators and global events. Interest rate cuts are typically made to stimulate economic growth during periods of economic slowdown or to prevent a recession. In this article, we will explore the factors that influence the Fed’s decision-making process and attempt to predict when the next interest rate cut might occur.

Factors Influencing Interest Rate Cuts

  1. Economic Data:
    • Gross Domestic Product (GDP): A slowing GDP growth rate is a strong indicator that the economy may need a boost.
    • Unemployment Rate: An increase in unemployment could signal economic weakness.
    • Inflation: If inflation remains below the Fed’s target (currently around 2%), it may prompt rate cuts to stimulate demand and push inflation higher.
  2. Financial Market Conditions:
    • Stock Markets: Persistent declines in stock markets can lead to reduced consumer confidence and spending, prompting the Fed to cut rates.
    • Bond Yields: Inverted yield curves (where short-term rates are higher than long-term rates) often precede recessions and may trigger rate cuts.
  3. Global Economic Trends:
    • Trade Policies: Tariffs and trade disputes can negatively impact the U.S. economy, leading to calls for rate cuts.
    • Foreign Exchange Rates: A strong U.S. dollar can hurt exports, which might necessitate rate cuts to weaken the currency and improve competitiveness.
  4. Geopolitical Events:
    • Political Instability: Uncertainty caused by political events can dampen economic activity and encourage rate cuts.
    • Natural Disasters: Major disasters can disrupt economic activity and require stimulus measures.

Analyzing Current Conditions

As of July 31, 2024, the U.S. economy shows mixed signals. While the unemployment rate remains low, there are concerns about slowing GDP growth and inflation below the target level. Financial markets have been volatile, with some signs of an inverted yield curve. Global trade tensions have eased somewhat, but they remain a concern.

Forecasting the Next Rate Cut

Based on the current economic landscape, we can make an educated guess about when the next rate cut might occur. If the following conditions persist or worsen:

  • Economic Growth: If GDP growth continues to slow or enters negative territory.
  • Inflation: If inflation remains stubbornly low.
  • Financial Market Stress: If stock markets experience prolonged downturns or bond yields continue to invert.

Prediction:

Given the current state of the economy and assuming no significant improvements, we predict that the next interest rate cut by the Federal Reserve could occur in the fourth quarter of 2024 or early 2025. This prediction is contingent on the persistence of the aforementioned economic pressures and the absence of significant positive developments.

While predicting exact dates for interest rate cuts is challenging, analyzing key economic indicators can provide valuable insights. The Federal Reserve’s decisions are influenced by a variety of factors, and the timing of the next rate cut will depend on how these factors evolve. Traders and investors should monitor economic data releases, Fed statements, and market movements to stay informed about potential changes in monetary policy.

Disclaimer: This article provides a general forecast based on current conditions and should not be taken as financial advice. The actual timing of interest rate cuts will depend on various factors and can differ significantly from predictions. It is always advisable to consult with a financial advisor and conduct thorough research before making investment decisions.

If you wish to get the latest forex brokers news,you can visit our Top Forex Brokers official website:

https://www.topforexbrokerscomparison.com

EURUSD BREAKS KEY LEVEL AND LOOKS WEAK

2016-12-09_09-50-38

EURUSD, Daily               

The euro eked out a fresh low versus the dollar while yen edged out a new low as most stock markets in Asia picked up the risk-on vibe imparted by the ECB’s announcement of a net increase in stimulus. EURUSD posted a four-day low at 1.0589 in Asian trade before settling to a narrow range in the low 1.06s. USDJPY logged a four-session peat at 114.56, nearing the 114.82 10-month peak seen on November 30. Yen crosses were also firmer today, pointing to a generally soft tone in the Japanese currency. Elsewhere, USDCAD consolidated above the two-month high of yesterday, despite a second day of gains in oil prices. AUDUSD oscillated around 0.7450, holding well within yesterday’s range.  European Stock markets, which rallied in the wake of the ECB announcement yesterday, are mixed, with the DAX down -0.11%, against a gain of 0.11% in the French CAC 40 and a rise of 0.13% in the FTSE 100. Eurozone peripherals, which outperformed yesterday, are underperforming and the Italian MIB is down nearly 1%.

The EURUSD closed significantly below the key 20 DMA last night and a SHORT position was opened at 1.0620.There could be some consolidation around this key level, as the Parabolic SAR remains positive and the Bollinger bands are compressing.  Target 1 is 1.0550 and then a retest of recent low at 1.0503 and Target 2 1.0500.Thereafter, next support appears at 1.0160, parity 1.000 and 0.9880.  The MACD, RSI and OBV are all suggesting more weakness ahead.

Janne Muta

Chief Market Analyst

If you wish to get the latest forex brokers news,you can visit our Top Forex Brokers official website:

http://www.topforexbrokerscomparison.com

About Janne Muta, HotForex’s Chief Market Analyst

jmutaJanne Muta is a seasoned industry professional with over 16 years experience in the global markets. Originally from Finland, Janne has worked for institutions in both Helsinki and London as an institutional fund manager, global market analyst and FX educator.

Traders and fund managers from around the world have benefited greatly from Janne’s technical analysis methods. The indicators and price action based trading models he has developed, have, after rigorous testing, proven to be invaluable in identifying high probability trades.


“My mission is to help you to become a confident and successful trader”

Disclaimer: This material is provided as a general marketing communication for information purposes only and does not constitute an independent investment research. Nothing in this communication contains, or should be considered as containing, an investment advice or an investment recommendation or a solicitation for the purpose of buying or selling of any financial instrument. All information provided is gathered from reputable sources and any information containing an indication of past performance is not a guarantee or reliable indicator of future performance. Users acknowledge that any investment in FX and CFDs products is characterized by a certain degree of uncertainty and that any investment of this nature involves a high level of risk for which the users are solely responsible and liable. We assume no liability for any loss arising from any investment made based on the information provided in this communication. This communication must not be reproduced or further distributed without our prior written permission.