The forex market never sleeps, and neither do the best automated trading systems. With daily volumes exceeding $7 trillion and algorithms now handling the vast majority of transactions, retail traders are increasingly turning to Expert Advisors (EAs), forex robots, and algorithmic platforms to stay competitive. But not all automated forex systems deliver on the hype. After digging into performance data, user feedback, and real-world results, here’s a practical guide to the top options in 2026 and how to approach them without losing your shirt.
Understanding Automated Forex Trading
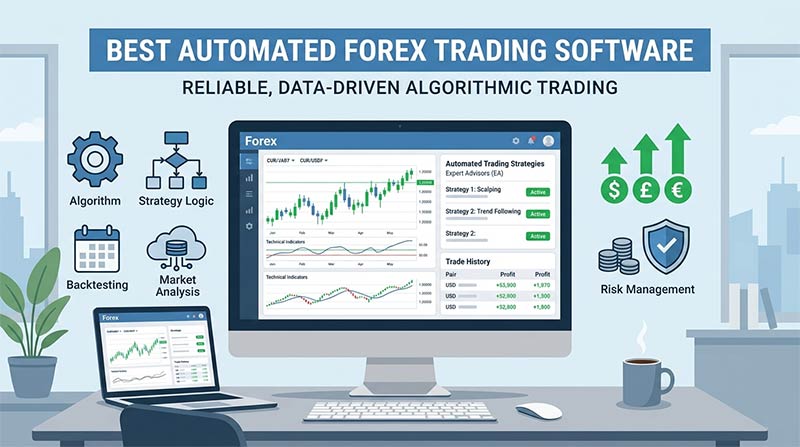
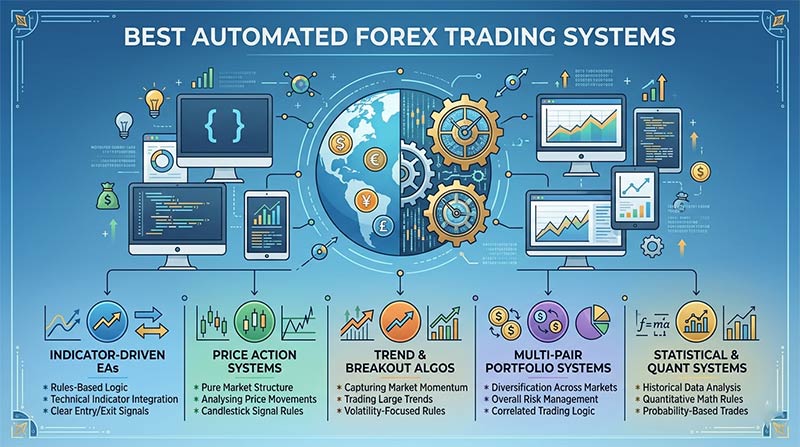
Automated forex systems—often called forex robots or EAs—execute trades based on predefined rules, technical indicators, or even AI-driven models. They run on platforms like MetaTrader 4 (MT4) and MetaTrader 5 (MT5), scanning markets 24/5, removing emotional decisions, and reacting in milliseconds. Popular strategies include scalping, trend following, grid trading, and volatility breakouts.
These tools appeal especially to part-time traders who can’t stare at charts all day. Yet success depends far more on the underlying strategy, broker choice, and risk management than on flashy marketing claims.
Key Advantages of Automated Forex Systems
- Emotion-Free Execution: No revenge trading or hesitation during news events.
- Speed and Consistency: Algorithms stick to rules around the clock and handle multiple pairs simultaneously.
- Backtesting Capabilities: You can test strategies on historical data before risking capital.
- Accessibility: Even beginners can start with copy-trading features or simple EAs on regulated brokers.
In practice, many traders report steadier results once they stop micromanaging every pip.
The Risks You Can’t Ignore
No system is foolproof. Markets shift, slippage happens, and over-optimized robots often fail in live conditions. Common pitfalls include:
- High drawdowns during unexpected volatility.
- Technical failures (internet outages, VPS issues, or platform glitches).
- Scams promising unrealistic win rates (90%+ is a major red flag).
- Curve-fitting: Great on backtests, terrible forward.
Reputable sources suggest legitimate EAs typically achieve 50-75% win rates over time, with verified results on platforms like Myfxbook being essential. Always use a demo account first and never risk money you can’t afford to lose.
Top Automated Forex Systems and Platforms
Several stand out based on longevity, verified performance, and trader feedback. Here’s a comparison of notable options:
| System/EA | Strategy Focus | Key Strengths | Approx. Cost | Best For | Verified Notes |
|---|---|---|---|---|---|
| Forex Fury | Range scalping | Disciplined, high win rate, adaptable | $229–$439 | Beginners & steady gains | Strong Myfxbook history |
| Waka Waka EA | Grid trading | Low drawdown, consistent | Higher premium | Experienced traders | Multi-year real-money proof |
| Flex EA | Multiple (customizable) | Virtual trades, MT4/MT5 support | Varies | Custom strategy users | Long track record since 2012 |
| Forex Robotron | Night scalping (EUR) | Fixed-time, tested performance | $299–$999 | Specific pair focus | Solid user reviews |
MetaTrader 4/5 remains the dominant platform for running these EAs, with brokers like Pepperstone, Eightcap, and AvaTrade offering excellent execution and low spreads for algo trading.
Other noteworthy mentions include systems from providers with active communities and third-party verification. Trends toward AI-assisted strategies are growing, but the fundamentals—solid risk rules and proper money management—still matter most.
How to Choose and Implement the Right System
- Verify Performance: Demand long-term, independent verified results (Myfxbook, FX Blue). Ignore unproven backtests.
- Broker Compatibility: Choose regulated brokers with fast execution, deep liquidity, and EA-friendly conditions (e.g., Pepperstone or Eightcap).
- Risk Management: Set proper stop-losses, position sizing, and maximum drawdown limits. Start small.
- VPS Hosting: Run your EA on a reliable Virtual Private Server for 24/7 uptime.
- Ongoing Monitoring: Automation doesn’t mean “set and forget.” Review performance regularly and adapt to market regimes.
- Education First: Understand the strategy behind the robot. Blindly following black-box systems rarely ends well.
Resources like Admiral Markets’ guide to automated software or Forex Tester for backtesting can help you evaluate options.
Automated Forex Trading
Having analyzed countless trading tools and market behaviors, I’m convinced automation levels the playing field for disciplined retail traders—but it’s no magic bullet. The real edge comes from combining technology with human oversight. Markets in 2026 are more efficient and algorithm-driven than ever, rewarding systems that adapt rather than those promising overnight riches.
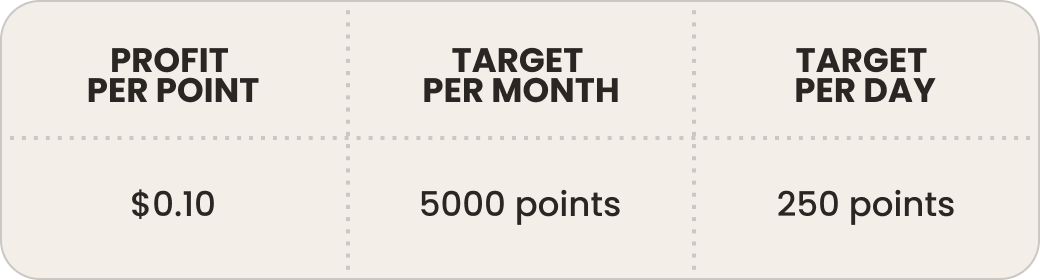
I’ve seen too many beginners blow accounts chasing “guaranteed” robots. The ones who succeed treat automation as a tool, not a replacement for learning. They backtest thoroughly, diversify across strategies, and maintain realistic expectations (consistent 1-5% monthly returns with controlled risk is impressive, not 20%+).
If you’re considering an automated forex system, start with a reputable MT4/MT5 EA on a demo account. Focus on brokers that support algorithmic trading and prioritize transparency. The technology is powerful, but patience and risk control remain irreplaceable.
Ready to explore? Research brokers like Pepperstone or Eightcap and test a few verified EAs yourself. The market rewards preparation over hype.

These awards confirm our commitment to building a rewarding trading environment and helping you uncover your potential. Thank you for choosing to trade with an award-winning broker!
Choose MetaTrader 5 with Top Forex Brokers?
•Blazing-fast execution & enhanced stability
•38 built-in technical indicators & 21 timeframes for precision trading
•Optimized for all devices—desktop, mobile & web
•Trade a wide range of assets: Stocks, Commodities, Forex & more!
https://www.topforexbrokerscomparison.com
Disclaimer: These forex trading signals are for educational purposes only and not financial advice. Trading carries significant risks, including the potential loss of your entire investment. Always consult a professional advisor before jumping in.