Weekly Forex Trading Signals For 09.02- 09.08.2024
Weekly Wrap-Up Germany’s Ifo Business Climate fell to 86.6 in August, the lowest since February, down from 87 in July due to rising pessimism among companies. US new orders for durable goods soared 9.9% in July, rebounding from a revised 6.9% decline, the biggest increase since May 2020. Australia’s CPI rose 3.5% year-over-year to July, down from 3.8% in June, the lowest since March, thanks to the Energy Bill Relief Fund. US GDP grew at a 3.0% annual rate in Q2 2024, up from 2.8% initially estimated and 1.4% in Q1. The US core PCE price index, the Fed’s preferred inflation measure, rose 0.2% month-over-month in July 2024.
This Week’s Highlights This week’s key economic releases are scheduled as follows: Swiss Consumer Price Index (Tuesday) US ISM Manufacturing PMI (Tuesday) Australia Gross Domestic Product (Wednesday) Bank of Canada Rate Statement and Overnight Rate Decision (Wednesday) US JOLTS Job Openings (Wednesday) US ADP Non-Farm Employment Change, Unemployment Claims, and ISM Services PMI (Thursday) US and Canada Labor Data (Friday)
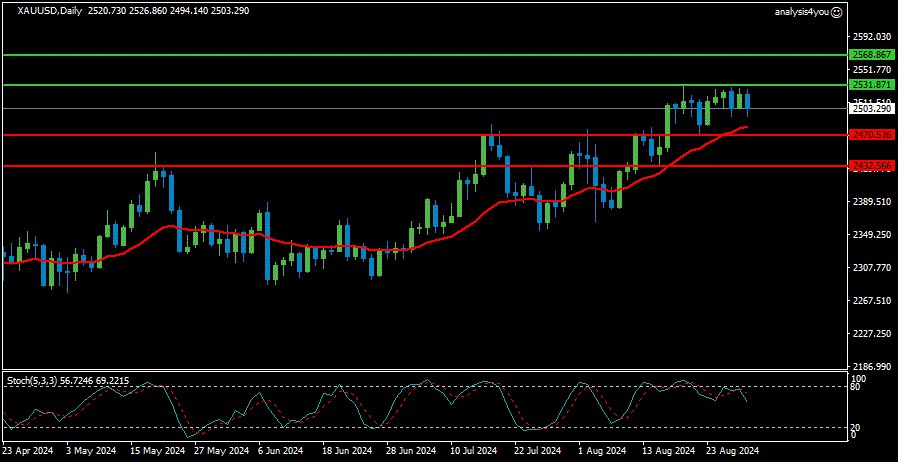
This week, expect high volatility in the XAU/USD (Gold) pair due to economic events in the US that may have an impact. Resistance: $2,531.87; $2,568.87 Support: $2,470.54; $2,432.57
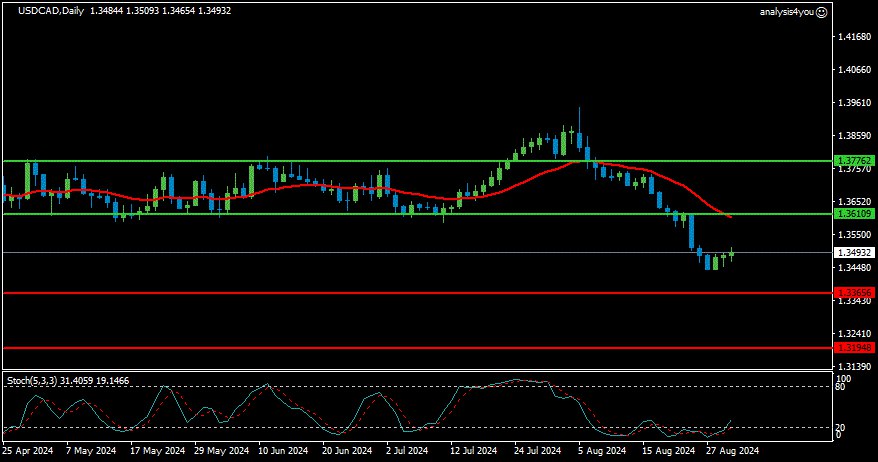
This week, expect high volatility in the USD/CAD pair due to Bank of Canada rate decisions and various economic events in Canada. Resistance: 1.3611; 1.3776 Support: 1.3366; 1.3195
In today’s volatile financial markets, staying ahead of the curve is essential for traders looking to maximize their profits. Here’s a detailed analysis of the current forex market trends, focusing on key pairs and assets such as EUR/USD, GBP/USD, USD/JPY, gold, and Bitcoin. We aim to provide free trading signals that can help guide your investment decisions on September 3, 2024.
EUR/USD (Current Price: 1.1039)
The EUR/USD pair has been experiencing a slight bullish trend over the past few weeks, supported by positive economic data coming out of the Eurozone. However, geopolitical tensions and the upcoming ECB meeting could introduce volatility into the pair. Traders should look for potential buying opportunities if the price consolidates above the 1.1040 level. A break below 1.1000 might indicate a reversal, suggesting a short position.
Signal: Buy on consolidation above 1.1040; Sell if it breaks below 1.1000.
GBP/USD (Current Price: 1.3097)
The British Pound has shown resilience against the Dollar, despite ongoing Brexit negotiations. The GBP/USD pair is currently trading at 1.3097, indicating a stable but cautious market sentiment. Given the uncertainty surrounding the UK’s economic policies, traders might want to adopt a wait-and-see approach. However, a sustained move above 1.3120 could signal a continuation of the uptrend, while a drop below 1.3050 could suggest a bearish turn.
Signal: Buy on a strong break above 1.3120; Sell if it drops below 1.3050.
USD/JPY (Current Price: 145.82)
The USD/JPY pair has been influenced by risk appetite in global markets. With the current price at 145.82, traders should monitor the pair closely as it approaches significant resistance levels. A break above 146.00 might signal further strength, while a retreat below 145.50 could suggest a correction. Economic indicators and risk sentiment will play a critical role in determining the direction of this pair.
Signal: Buy on a clear break above 146.00; Sell if it falls below 145.50.
Gold (Current Price: 2484.04)
Gold prices have surged due to its safe-haven appeal amidst geopolitical uncertainties. Currently priced at 2484.04 per ounce, gold is trading near its all−time highs. If geopolitical risks persistor increase, gold could continue torise. Traders should watch for support around 2484.04 per ounce, gold is trading near its all−time highs. If geopolitical risks persistor increase, gold could continuetorise. Traders should watch for support around 2470. A bounce off this level could be a buying opportunity, while a break below it might suggest a deeper correction.
Signal: Buy on a bounce off 2470 support; Sell if it breaks below 2470 support; Sell if it breaks below 2470.
BTCUSD (Current Price: 57742.56)
Bitcoin, the leading cryptocurrency, has seen steady growth as more institutional investors enter the market. At 57742.56, BTC is showing signs of stability. Adecisive move above 57742.56, BTC is showing signs of stability. Adecisive move above 58000 could indicate further upside, while a decline below $57000 might suggest a short-term pullback. As always with cryptocurrencies, high volatility should be expected, and proper risk management is crucial.
Signal: Buy on a strong move above 58000;Sell if it dips below 58000;Sell if it dips below 57000.
If you wish to get the latest forex brokers news,you can visit our Top Forex Brokers official website:
Please note that these signals are provided for informational purposes only and do not constitute financial advice. Always conduct your own research and consider consulting with a financial advisor before making any trading decisions. Keep an eye on economic news, central bank statements, and geopolitical developments, as they can significantly impact forex markets. Happy trading!
Navigating the forex market successfully requires a combination of technical analysis, understanding of economic indicators, and awareness of global events. We provide free forex trading signals for key currency pairs and commodities based on actual points and trends as of August 30, 2024. Let’s explore the current market conditions and identify potential trading opportunities.
EUR/USD (Euro to US Dollar)
Current Price: 1.1068
The EUR/USD pair has continued its downtrend, with the current price standing at 1.1068. The pair has tested the support level at 1.1050, which could provide a good entry point for traders interested in long positions. Resistance is seen at the 1.1150 level. The RSI (Relative Strength Index) is currently in the neutral zone, suggesting that the pair is neither overbought nor oversold. The MACD (Moving Average Convergence Divergence) indicator is showing a bearish signal, indicating that the downtrend may persist.
Support: 1.1050 Resistance: 1.1150
Trading Signal: Consider a long position if the pair bounces off the support at 1.1050 with a stop-loss at 1.1000 and take-profit at 1.1150.
GBP/USD (British Pound to US Dollar)
Current Price: 1.3157
The GBP/USD pair has been trading in a tight range, with the current price at 1.3157. The pair has found support at the 1.3150 level, which could provide a good entry point for long positions. Resistance is seen at the 1.3250 level. The RSI is in the neutral zone, indicating that the pair is neither overbought nor oversold. The MACD is showing a slight bullish divergence, suggesting that there may be an opportunity for an upward move.
Support: 1.3150 Resistance: 1.3250
Trading Signal: Consider a long position if the pair breaks above 1.3250 with a stop-loss at 1.3150 and take-profit at 1.3350.
USD/JPY (US Dollar to Japanese Yen)
Current Price: 145.61
The USD/JPY pair has broken above the 145.00 resistance level, with the current price at 145.61. The pair is testing new highs, and the next resistance level is at 146.00. Support is seen at 144.00. The RSI is slightly overbought, indicating that the pair may need to consolidate or pull back before continuing its upward trend. The MACD is showing a bullish signal, suggesting that the uptrend may continue.
Support: 144.00 Resistance: 146.00
Trading Signal: Consider a long position if the pair breaks above 146.00 with a stop-loss at 144.00 and take-profit at 147.00.
Gold
Current Price: 2519.97
Gold, often considered a safe-haven asset, is trading at 2519.97. The RSI is currently neutral, suggesting that the metal may not be significantly overbought or oversold. The MACD is showing a slight bullish crossover, indicating that there may be an opportunity for an upward move. The 2500 level is acting as a psychological support level, while the next resistance level is at 2550.
Support: 2500 Resistance: 2550
Trading Signal: Consider a long position if the price breaks above 2550 with a stop-loss at 2500 and take-profit at 2600.
BTC/USD (Bitcoin to US Dollar)
Current Price: 59557.47
Bitcoin has been trading within a range, with the current price at 59557.47. The cryptocurrency has found support at the 59,000 level, and the RSI is in the neutral zone, indicating that the asset is not significantly overbought or oversold. The MACD is showing a bullish signal, suggesting a potential upward trend.
Support: 59,000 Resistance: 60,000
Trading Signal: Consider a long position if the price breaks above 60,000 with a stop-loss at 59,000 and take-profit at 61,000.
If you wish to get the latest forex brokers news,you can visit our Top Forex Brokers official website:
These trading signals are based on technical analysis and current market conditions as of August 30, 2024. It’s important to stay updated with the latest news and economic indicators that may affect these markets. Always use appropriate risk management strategies and consider consulting with a financial advisor before making any trading decisions. Remember that trading involves risks, and these signals are provided for informational purposes only.
Forex trading requires a thorough understanding of market trends, technical analysis, and economic indicators. In this article, we provide free forex trading signals for key currency pairs and commodities based on actual points and trends as of August 29, 2024. Let’s dive into the analysis:
EUR/USD (Euro to US Dollar)
Current Price: 1.1092
The EUR/USD pair has experienced a slight downtrend, with the current price at 1.1092. The pair has found support at the 1.1050 level, which could be a good entry point for traders looking to establish long positions. Resistance is seen at the 1.1150 level. The RSI (Relative Strength Index) is currently neutral, suggesting that the pair is neither overbought nor oversold. The MACD (Moving Average Convergence Divergence) indicator is showing a bearish signal, which indicates that the downtrend may continue in the short term.
Support: 1.1050 Resistance: 1.1150
Trading Signal: Consider a long position if the pair bounces off the support at 1.1050 with a stop-loss at 1.1000 and take-profit at 1.1150.
GBP/USD (British Pound to US Dollar)
Current Price: 1.3176
The GBP/USD pair has been trading in a narrow range, with the current price at 1.3176. The pair has found support at the 1.3150 level, which could provide a good entry point for long positions. Resistance is seen at the 1.3250 level. The RSI is in the neutral zone, indicating that the pair is neither overbought nor oversold. The MACD is showing a slight bullish divergence, suggesting that there may be an opportunity for an upward move.
Support: 1.3150 Resistance: 1.3250
Trading Signal: Consider a long position if the pair breaks above 1.3250 with a stop-loss at 1.3150 and take-profit at 1.3350.
USD/JPY (US Dollar to Japanese Yen)
Current Price: 144.60
The USD/JPY pair has been trending upwards, with the current price at 144.60. The pair is testing the 145.00 resistance level, which could be a key level to watch. Support is seen at 144.00. The RSI is slightly overbought, indicating that the pair may need to consolidate or pull back before continuing its upward trend. The MACD is showing a bullish signal, suggesting that the uptrend may continue.
Support: 144.00 Resistance: 145.00
Trading Signal: Consider a long position if the pair breaks above 145.00 with a stop-loss at 144.00 and take-profit at 146.00.
Gold
Current Price: 2516.50
Gold, often seen as a safe-haven asset, has been trading steadily at 2516.50. The RSI is currently neutral, suggesting that the metal may not be significantly overbought or oversold. The MACD is showing a slight bullish crossover, indicating that there may be an opportunity for an upward move. The 2500 level is acting as a psychological support level, while the next resistance level is at 2550.
Support: 2500 Resistance: 2550
Trading Signal: Consider a long position if the price breaks above 2550 with a stop-loss at 2500 and take-profit at 2600.
BTC/USD (Bitcoin to US Dollar)
Current Price: 60039.17
Bitcoin has broken above the 60,000 level, with the current price at 60039.17. The cryptocurrency has found support at the 59,000 level, and the RSI is in the neutral zone, indicating that the asset is not significantly overbought or oversold. The MACD is showing a bullish signal, suggesting a potential upward trend.
Support: 59,000 Resistance: 61,000
Trading Signal: Consider a long position if the price breaks above 61,000 with a stop-loss at 59,000 and take-profit at 63,000.
If you wish to get the latest forex brokers news,you can visit our Top Forex Brokers official website:
These trading signals are based on technical analysis and current market conditions as of August 29, 2024. It’s important to stay updated with the latest news and economic indicators that may affect these markets. Always use appropriate risk management strategies and consider consulting with a financial advisor before making any trading decisions. Remember that trading involves risks, and these signals are provided for informational purposes only.
Forex trading is a dynamic and complex market that requires a deep understanding of current trends and economic indicators. In this article, we provide free forex trading signals for key currency pairs and commodities based on actual points and trends as of August 28, 2024. Let’s delve into the analysis:
EUR/USD (Euro to US Dollar)
Current Price: 1.1126
The EUR/USD pair has been consolidating around the 1.1126 level, indicating a lack of clear direction in the market. The pair has found support at the 1.1050 level, which could provide a good entry point for traders looking to enter long positions. On the other hand, the resistance level is at 1.1200. The RSI (Relative Strength Index) is currently neutral, suggesting that the pair is neither overbought nor oversold. The MACD (Moving Average Convergence Divergence) indicator is also indicating a neutral stance, with no significant divergence.
Support: 1.1050 Resistance: 1.1200
Trading Signal: Consider a long position if the pair breaks above 1.1200 with a stop-loss at 1.1100 and take-profit at 1.1300.
GBP/USD (British Pound to US Dollar)
Current Price: 1.3217
The GBP/USD pair has been trading in a tight range, with the current price at 1.3217. The pair has found support at the 1.3150 level, which could provide a good entry point for long positions. Resistance is seen at 1.3300. The RSI is in the neutral zone, indicating that the pair is neither overbought nor oversold. The MACD is showing a slight bullish divergence, suggesting that there may be an opportunity for an upward move.
Support: 1.3150 Resistance: 1.3300
Trading Signal: Consider a long position if the pair breaks above 1.3300 with a stop-loss at 1.3150 and take-profit at 1.3400.
USD/JPY (US Dollar to Japanese Yen)
Current Price: 144.57
The USD/JPY pair has been trending upwards, with the current price at 144.57. The pair is testing the 145.00 resistance level, which could be a key level to watch. Support is seen at 144.00. The RSI is slightly overbought, indicating that the pair may need to consolidate or pull back before continuing its upward trend. The MACD is showing a bullish signal, suggesting that the uptrend may continue.
Support: 144.00 Resistance: 145.00
Trading Signal: Consider a long position if the pair breaks above 145.00 with a stop-loss at 144.00 and take-profit at 146.00.
Gold
Current Price: 2506.60
Gold, often seen as a safe-haven asset, has been trading steadily at 2506.60. The RSI is currently neutral, suggesting that the metal may not be significantly overbought or oversold. The MACD is showing a slight bullish crossover, indicating that there may be an opportunity for an upward move. The 2500 level is acting as a psychological support level, while the next resistance level is at 2550.
Support: 2500 Resistance: 2550
Trading Signal: Consider a long position if the price breaks above 2550 with a stop-loss at 2500 and take-profit at 2600.
BTC/USD (Bitcoin to US Dollar)
Current Price: 59386.90
Bitcoin has been trading within a range, with the current price at 59386.90. The cryptocurrency has found support at the 58000 level, and the RSI is in the neutral zone, indicating that the asset is not significantly overbought or oversold. The MACD is showing a bullish signal, suggesting a potential upward trend.
Support: 58000 Resistance: 60000
Trading Signal: Consider a long position if the price breaks above 60000 with a stop-loss at 58000 and take-profit at 62000.
If you wish to get the latest forex brokers news,you can visit our Top Forex Brokers official website:
These trading signals are based on technical analysis and current market conditions as of August 27, 2024. It’s important to stay updated with the latest news and economic indicators that may affect these markets. Always use appropriate risk management strategies and consider consulting with a financial advisor before making any trading decisions. Remember that trading involves risks, and these signals are provided for informational purposes only.
Today’s forex market signals offer insights into some of the most actively traded currency pairs, along with gold and Bitcoin. Here’s a brief analysis based on current price levels and recent trends.
EUR/USD (European Euro vs. US Dollar)
Current Price: 1.1164
Analysis: The EUR/USD pair has seen a slight downtrend over the past week, with the price breaking below the 1.1200 psychological level. With the current price at 1.1164, traders might consider looking for short positions if the pair continues to show bearish sentiment. Key resistance levels are located at 1.1200 and 1.1250, while support can be found around 1.1100 and 1.1050. A break below 1.1100 could signal further weakness in the pair.
GBP/USD (British Pound vs. US Dollar)
Current Price: 1.3182
Analysis: The GBP/USD pair has been relatively stable recently, hovering around the 1.3200 area. At the current price of 1.3182, the pair seems to be consolidating within a narrow range. Traders may want to wait for a clear breakout above 1.3250 or below 1.3100 before entering any positions. The economic calendar today does not indicate significant news releases that could impact the pair, suggesting a likely continuation of the current trend.
USD/JPY (US Dollar vs. Japanese Yen)
Current Price: 144.17
Analysis: The USD/JPY pair has shown strength as the dollar gains against the yen. At the current price of 144.17, the pair is trading near multi-year highs. Traders might consider long positions if the pair continues its upward momentum. Immediate resistance levels are at 144.50 and 145.00, with support at 143.50 and 143.00. A sustained move above 145.00 could indicate further upside potential.
Gold (XAU/USD)
Current Price: 2523.07
Analysis: Gold prices have surged to record highs, currently trading at 2523.07perounce.Thepreciousmetalcontinuestobenefitfromglobaleconomicuncertaintiesandlow−interest−rateenvironments.Tradersmightlookforlongpositionsasgoldremainsinastronguptrend.Immediatesupportisat2523.07perounce.Thepreciousmetalcontinuestobenefitfromglobaleconomicuncertaintiesandlow−interest−rateenvironments.Tradersmightlookforlongpositionsasgoldremainsinastronguptrend.Immediatesupportisat2500, with key resistance at 2550.Abreakabove2550.Abreakabove2550 could signal a continuation of the bull run.
Bitcoin (BTC/USD)
Current Price: 63864.49
Analysis: Bitcoin has maintained its bullish trend, currently trading at 63,864.49.Thecryptocurrencyhasbeenshowingresiliencedespiteregulatoryconcernsandoccasionalcorrections.Tradersmightconsiderlongpositionsifthepriceholdsabovethe63,864.49.Thecryptocurrencyhasbeenshowingresiliencedespiteregulatoryconcernsandoccasionalcorrections.Tradersmightconsiderlongpositionsifthepriceholdsabovethe60,000 level. Key support levels are at 60,000and60,000and58,000, with resistance at 65,000and65,000and68,000. A break above $65,000 could suggest a continuation of the uptrend.
If you wish to get the latest forex brokers news,you can visit our Top Forex Brokers official website:
These signals are provided for informational purposes only and do not constitute financial advice. Traders should conduct their own research and consider their risk tolerance before making any trading decisions. Stay tuned for more updates and analysis on the forex market.
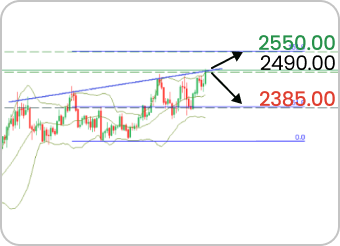
XAUUSD XAUUSD, currently in a long-term uptrend, has reached the trend line and is testing its all-time high (ATH). Despite strong bullish momentum, the price has hit the upper Bollinger Band, with a divergence appearing in the Money Flow Index (MFI).
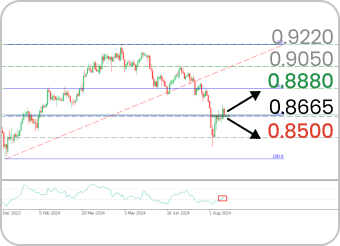
•If gold breaks the trend line above 2490, the target is likely to be at 2550; •A rebound from the trend line can bring XAUUSD back to the support of 2385, corresponding to 61.8 Fibonacci. USDCHF USDCHF is consolidating at 61.8 Fibonacci in a long-term bearish trend after bouncing off the support. Despite the bearish sentiment, DeMarker has moved out of the oversold zone.
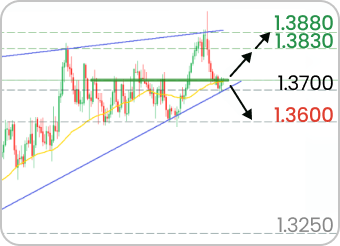
•If the price falls below 0.8665 support, it can return to 0.8500 level; •A rebound from the support will allow USDCHF to rise to 0.8880. USDCAD In the Daily timeframe, USDCAD has formed a rising wedge pattern in a long-term bullish trend. The price reached the lower trend line and is holding near MA50.
•If USDCAD breaks the resistance at 1.3730 and MA50, it may rise to 1.3830 and then to 1.3880. •Breaking the trend line and falling below 1.3700 may prompt a bearish scenario to 1.3600.
*Trading Signal tips and analytics do not constitute a call to trade, trading advice or recommendation and are for information only.
If you wish to get the latest forex brokers news,you can visit our Top Forex Brokers official website:
August 19, 2024 – In today’s volatile market environment, staying ahead of the curve with accurate and timely forex trading signals is essential for traders looking to maximize their returns while minimizing risk. In this article, we provide free forex trading signals for some of the most popular currency pairs and commodities, including EUR/USD, GBP/USD, USD/JPY, gold, and BTC/USD. These signals are based on current market conditions as of August 19, 2024, and recent trends.
EUR/USD (Current Price: 1.1070)
The EUR/USD pair has been consolidating around the 1.1070 level. Recent economic data from the Eurozone, such as the release of the ZEW Economic Sentiment Index, has shown a slight improvement, suggesting a potential bullish trend. However, geopolitical tensions and uncertainty regarding monetary policy by the European Central Bank (ECB) could limit the upside. Trading Signal: Consider going long if the price breaks above 1.1100, targeting 1.1150, with a stop loss below 1.1040.
GBP/USD (Current Price: 1.2990)
The British Pound has been under pressure due to concerns over the UK’s economic recovery and the ongoing Brexit negotiations. The current price at 1.2990 indicates a slight bearish bias, supported by the recent decline in retail sales data. Trading Signal: A short position might be considered if the price breaks below 1.2950, aiming for 1.2880, with a stop loss above 1.3040.
USD/JPY (Current Price: 146.31)
The USD/JPY pair continues to trade near its recent highs, reflecting the strength of the US dollar and the safe-haven appeal of the Japanese Yen. With the Federal Reserve expected to maintain its hawkish stance, the pair may see further upside. Trading Signal: Going long above 146.50 could be a good strategy, with a target of 147.00 and a stop loss below 145.80.
Gold (Current Price: 2502.08)
Gold prices have been on the rise, reaching 2502.08 per ounce. This increase can beat tributed to inflationary pressures and global economic uncertainties. Technical indicators suggest that gold remains in a strong uptrend.
TradingSignal: Long position sarefavored, with an entry point at 2502.08 per ounce. This increase can beat tributed to inflationary pressures and global economic uncertainties. Technical indicators suggest that gold remains in a strong uptrend.
TradingSignal: Long position sarefavored, with an entry point at 2505, aiming for 2520, and a stop loss placed at 2520, and a stop loss placed at 2490.
BTC/USD (Current Price: 58225.29)
Bitcoin has seen significant volatility but has maintained its upward momentum. At 58,225.29, Bitcoin appears to be consolidating with in a bullish trend. Positive news regarding regulatory developments and institutional adoption could further boostits value.
TradingSignal: Consider buying above 58,225.29, Bitcoin appears to be consolidating within a bullish trend. Positive news regarding regulatory developments and institutional adoption could further boostits value.
TradingSignal: Consider buying above 58,500 with a target of 60,000 and a stop loss at 60,000 and a stop loss at 57,000.
If you wish to get the latest forex brokers news,you can visit our Top Forex Brokers official website:
These signals are intended to provide guidance and should be used in conjunction with your own analysis and risk management strategies. Always remember to set appropriate stop losses and take profits to protect your capital. Stay informed about economic releases and geopolitical events, as they can significantly impact the forex market. Happy trading!
August 16, 2024 — In today’s volatile foreign exchange market, staying ahead of the curve is crucial. As part of our commitment to helping traders make informed decisions, we’re providing free forex trading signals based on the latest market data and trends. Here’s a snapshot of the key currency pairs and commodities:
EUR/USD
Current Price: 1.0987
The EUR/USD pair has seen a significant increase in value, climbing by 0.50% over the course of the day. This upward trend may indicate a stronger euro against the US dollar. Traders should consider taking a long position if the price breaks above the resistance level at 1.1000. However, caution is advised as geopolitical factors could impact the direction of this pair.
GBP/USD
Current Price: 1.2884
The GBP/USD pair remains relatively stable, suggesting a period of consolidation. With no major economic news expected from the UK or the US today, the pair is likely to continue trading within a narrow range. A breakout from the current range (1.2850 – 1.2900) could signal a directional move. Traders should watch for volume increases and news releases that might affect the British pound.
USD/JPY
Current Price: 148.20
The USD/JPY pair is currently trading near its highest levels in several years. The strong dollar continues to push the pair higher, but traders should be wary of potential reversals. A pullback towards the 147.50 support level could present a buying opportunity. However, with the Bank of Japan’s policy meeting coming up next week, the pair may experience increased volatility.
Gold
Current Price: 2480.13
Gold prices have surged, reaching multi-year highs. As a safe-haven asset, gold often benefits from geopolitical tensions and economic uncertainty. With ongoing concerns about global growth, gold remains an attractive investment. Traders looking to enter the market should consider buying dips around the 2450 level,with a stop loss below 2450 level,with a stop loss below 2400.
BTC/USD
Current Price: 58108.45
Bitcoin has maintained its bullish momentum, currently trading just below the psychological level of 60,000.With increasing institutional interest and regulatory developments,Bitcoin’s future looks promising.Traders should keep an eye on the 60,000.With increasing institutional interest and regulatory developments,Bitcoin’s future looks promising.Traders should keep an eye on the 60,000 resistance level, and a break above it could trigger a further rally. However, due to the high volatility of cryptocurrencies, risk management is essential.
Technical Analysis Indicators:
EUR/USD: Watch for a close above 1.1000.
GBP/USD: Monitor the 1.2900 resistance level.
USD/JPY: Support at 147.50.
Gold: Buy dips around $2450.
BTC/USD: Breakout above $60,000.
If you wish to get the latest forex brokers news,you can visit our Top Forex Brokers official website:
Today’s trading signals suggest a mix of opportunities across different markets. It’s important to stay updated with the latest news and economic indicators, as they can significantly influence the direction of these financial instruments. Remember to always use proper risk management techniques when trading.
Disclaimer: The information provided is not financial advice. Always conduct your own research and consult with a professional before making any trading decisions.
Navigating the complex landscape of Forex trading requires timely insights and accurate signals. Today, we’re providing you with free Forex trading signals for some of the most actively traded currency pairs and commodities. These signals are designed to help you make informed trading decisions, based on the latest market trends and technical analysis.
EUR/USD: Consolidation Continues
Current Price: 1.0983
Analysis: The EUR/USD pair has been consolidating around the 1.0980 level, suggesting a period of stability. With the European Central Bank (ECB) maintaining a cautious stance and the U.S. Federal Reserve potentially signaling a pause in interest rate hikes, traders should watch for signs of a breakout. Resistance at 1.1000 and support at 1.0950 could offer key trading opportunities.
Signal:
Buy at 1.0980
Stop Loss: 1.0950
Take Profit: 1.1000
GBP/USD: Pound Hovers Near Support Levels
Current Price: 1.2861
Analysis: The GBP/USD pair has been trading near support levels, reflecting uncertainty surrounding economic policies and geopolitical factors. With the UK’s economic data showing mixed signals, the pair is likely to remain range-bound in the short term. Traders should look for a clear break above 1.2900 or below 1.2800 for directional cues.
Signal:
Sell at 1.2870
Stop Loss: 1.2900
Take Profit: 1.2820
USD/JPY: Yen Strengthens Amid Safe Haven Demand
Current Price: 148.95
Analysis: The USD/JPY pair has seen a slight decline as investors seek safe havens due to geopolitical tensions. The pair could test support at 148.00 if risk aversion continues. Conversely, a move back above 150.00 would suggest a return to risk-on sentiment.
Signal:
Buy at 148.95
Stop Loss: 148.00
Take Profit: 150.00
Gold: Bullion Shines Amid Market Uncertainty
Current Price: 2456.38
Analysis: Gold has continued to show strength, driven by uncertainties in global markets and expectations of lower interest rates. With gold breaking above the key resistance level of 2450, traders should consider this momentum as a buying opportunity.
Signal:
Buy at 2456.38
Stop Loss: 2440.00
Take Profit: 2475.00
BTC/USD: Cryptocurrency Eyes Next Resistance Level
Current Price: 59658.23
Analysis: Bitcoin has been on a steady climb, supported by increasing institutional adoption and positive regulatory developments. The cryptocurrency is currently testing resistance at 60,000, which, if broken, could lead to further gains.
Signal:
Buy at 59658.23
Stop Loss: 58500.00
Take Profit: 60500.00
If you wish to get the latest forex brokers news,you can visit our Top Forex Brokers official website:
These signals are intended to serve as a guide for traders looking to capitalize on the current market conditions. Remember, it’s essential to manage your risk and always use stop-loss orders to protect your capital. Keep an eye on economic news and central bank announcements, as these can significantly impact market movements.
Disclaimer: Trading involves risks, and past performance does not guarantee future results. Always conduct your own research and consult with a financial advisor before making trading decisions.